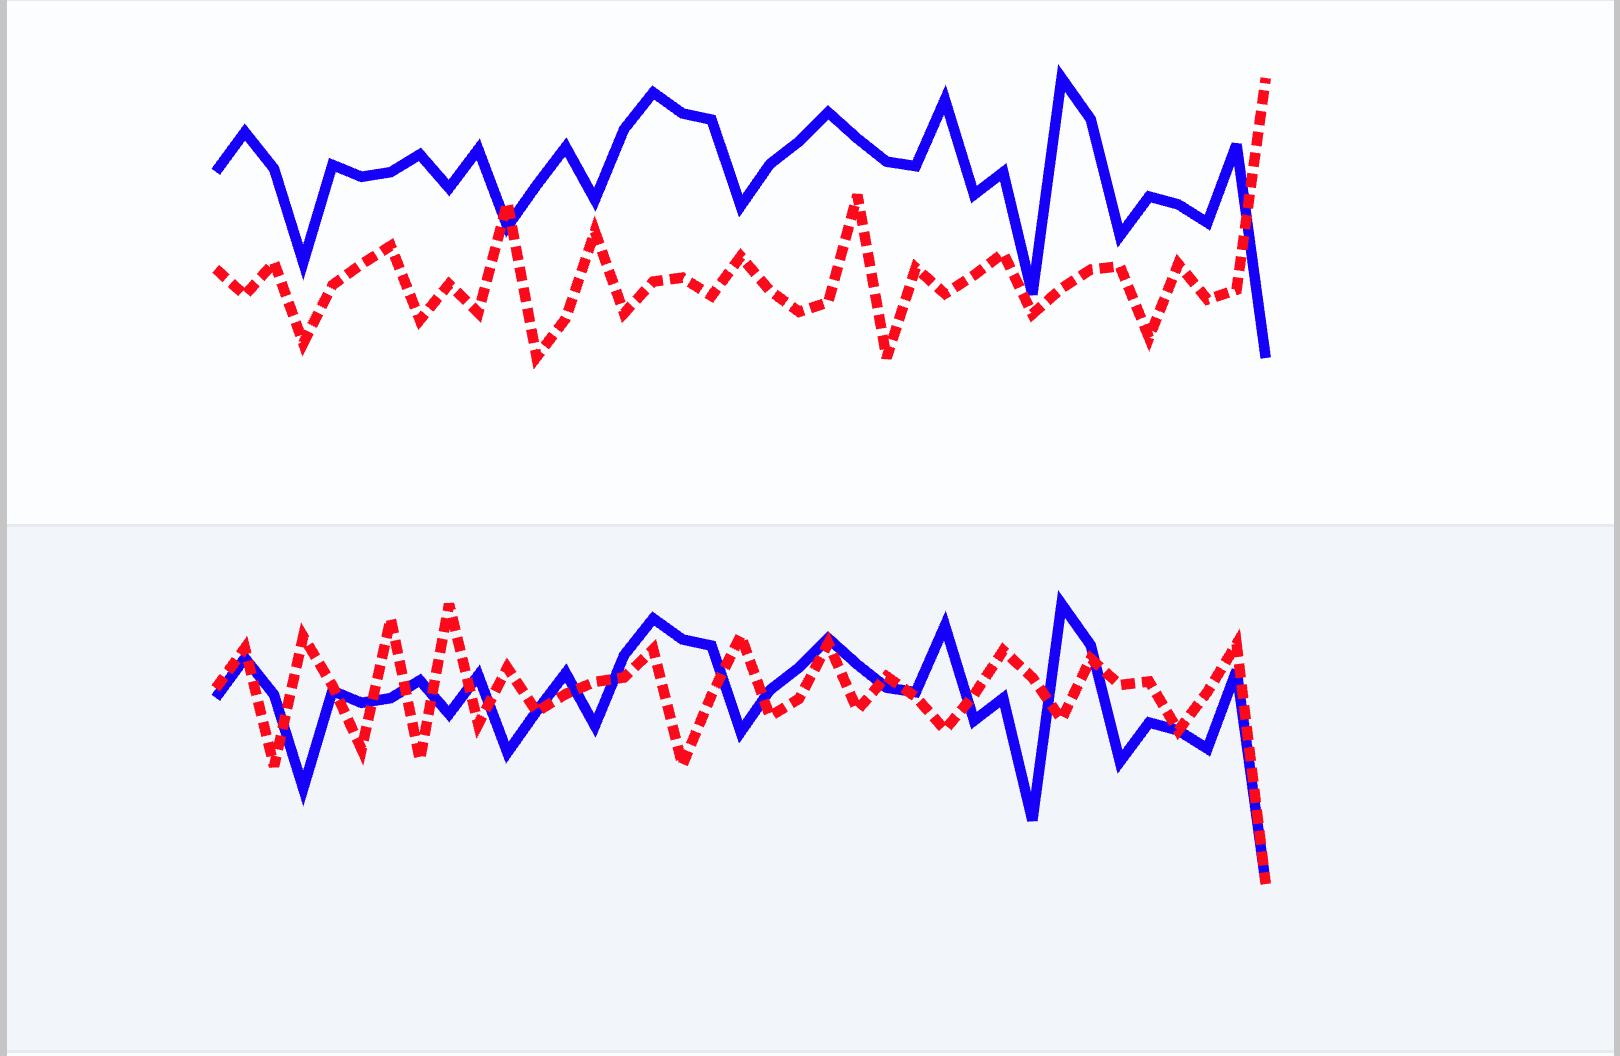
✎ᝰ plotting.dual_axis_line
The DualAxisLinePreparer class and its associated configuration dataclass
provide functionality to prepare and transform time series data for dual-axis
line plotting. This module is designed to help users visualize and compare two
series (typically a KPI and a feature) over time, with options for smoothing,
normalization, and transformation.
Overview
This module exposes:
A configuration dataclass for specifying time, target, and feature columns, as well as smoothing and normalization options.
A preparer class that:
Sorts and cleans time series data
Applies optional transformations (adstock, difference, lag)
Resamples data to reduce the number of points for visualization
Smooths and normalizes series for better comparison
Generates output suitable for plotting, including SVG point strings
Class Reference
- class owlmix.plotting.dual_axis_line.DualAxisLineDataConfig(time_column, target_column, feature_column, smoothing_method='rolling', window=3, normalize=True)
Dataclass for specifying dual axis line plot configuration.
- Parameters:
time_column (
str) – Name of the time column in the DataFrame.target_column (
str) – Name of the KPI/target column.feature_column (
str) – Name of the feature column to compare.smoothing_method (
str) – Smoothing method to use (“rolling”, “ema”, or None).window (
int) – Window size for smoothing.normalize (
bool) – Whether to normalize the series to [0, 1].
- class owlmix.plotting.dual_axis_line.DualAxisLinePreparer(df, config)
Prepares time series data for dual axis line plotting.
- Parameters:
df (
pandas.DataFrame) – Input DataFrame containing time, target, and feature columns.config (
DualAxisLineDataConfig) – Configuration parameters for the plot.
- apply_transformation(transformer_name: str, lag: int = 0) Self
Applies a transformation (adstock, difference, lag) to the feature column.
- Parameters:
transformer_name (
str) – Name of the transformer (“adstock”, “difference”, “lag”).lag (
int) – Lag value for lag transformation.
- Returns:
Self for method chaining.
- Return type:
DualAxisLinePreparer
- prepare(width: int = 300, height: int = 80, left_pad: int = 30, top_pad: int = 10) Dict[str, Any]
Prepares the data for plotting, applying sorting, cleaning, resampling, smoothing, normalization, and output formatting.
- Parameters:
width (
int) – Width of the plot area (for SVG point calculation).height (
int) – Height of the plot area.left_pad (
int) – Left padding for the plot.top_pad (
int) – Top padding for the plot.
- Returns:
Dictionary containing time, KPI, and feature series (raw, smoothed, normalized, min/max, SVG points).
- Return type:
Dict[str, Any]
Details
The output dictionary from prepare() contains:
time: List of time values as stringskpi: Dictionary with keysraw,smooth,normalized,min,max,pointsfeature: Dictionary with keysraw,smooth,normalized,min,max,points
Each points value is a string of SVG coordinates for plotting the normalized series.
Transformations
The following transformations are supported for the feature column:
Adstock: Applies adstock transformation with configurable decay.
Difference: Computes the difference over a specified period.
Lag: Shifts the series by a specified lag.
Smoothing Methods
Rolling: Moving average with a configurable window.
EMA: Exponential moving average.
None: No smoothing.
Sample Output
The prepared data can be used to create a dual-axis line plot where the KPI and feature series are plotted on the same time axis but with different y-axes. The smoothed and normalized series allow for better visual comparison, while the raw series can be used for reference.